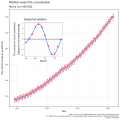
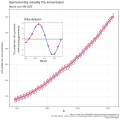
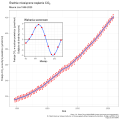
# Mauna Loa atmospheric CO2 change
# multi language plot for Wikipedia
# using different possible sources (Scripps if NOAA is not available)
#
# Used for /wiki/File:Mauna_Loa_CO2_monthly_mean_concentration.svg
# and related files in other languages. See all files in :
# /wiki/Template:Other_versions/Mauna_Loa_CO2_monthly_mean_concentration
#
# Update this script on :
# /w/index.php?title=Template:Other_versions/Mauna_Loa_CO2_monthly_mean_concentration.R&action=edit

# Required packages.   used for :
library(readr)         # reading data
library(dplyr)         # data processing
library(ggplot2)       # plot
library(gridExtra)     # plot positionning
library(scales)        # pretty breaks on plot axis
library(lubridate)     # date processing
library(httr)          # check url
library(Hmisc)         # ci from bootstrap

# install all locales beforehand, e.g. :
# sudo locale-gen ca_ES.UTF-8

old_locale <- Sys.getlocale("LC_TIME")

# Translations ------------------------------------------------------------

language <- list(

  ca_ES = list(
    locale_lc_time = "ca_ES.UTF-8",
    title = bquote("Mitjana mensual de la concentratió de"~CO[2]),
    subtitle = "Mauna Loa",
    caption_scripps = paste("dades : R. F. Keeling, S. J. Walker, S. C. Piper and A. F. Bollenbacher\nScripps CO2 Program (https://scrippsco2.ucsd.edu/). Visitada", Sys.Date()),
    caption_noaa = paste("dades : Dr. Pieter Tans, NOAA/ESRL (https://gml.noaa.gov/ccgg/trends/) i\n Dr. Ralph Keeling, Scripps Institution of Oceanography (https://scrippsco2.ucsd.edu/). Visitada ", Sys.Date()),
    x = "any",
    y = bquote("fracció de"~CO[2]~"en aire sec ("*mu*"mol/mol)"),
    x2 = "mes",
    y2 = bquote(atop("fracció de"~CO[2]~"en aire sec ("*mu*"mol/mol)",
                     "desviació de la mitjana anual")),
    title2 = "Variació mensual"
  ),

  cs_CZ = list(
    locale_lc_time = "cs_CZ.UTF-8",
    title = "Průměrné měsíční koncentrace oxidu uhličitého",
    subtitle = "Mauna Loa",
    caption_scripps = paste("data : R. F. Keeling, S. J. Walker, S. C. Piper a A. F. Bollenbacher\nScripps CO2 Program (https://scrippsco2.ucsd.edu/). Přístupné", Sys.Date()),
    caption_noaa = paste("data : Dr. Pieter Tans, NOAA/ESRL (https://gml.noaa.gov/ccgg/trends/) a\nDr. Ralph Keeling, Scripps Institution of Oceanography (https://scrippsco2.ucsd.edu/). Přístupné", Sys.Date()),
    x = "rok",
    y = bquote("koncentrace"~CO[2]~"v suchém vzduchu ("*mu*"mol/mol)"),
    x2 = "měsíc",
    y2 = bquote(atop("koncentrace"~CO[2]~"v suchém vzduchu ("*mu*"mol/mol)", "odchylka od ročního průměru")),
    title2 = "Měsíční změna (průměrná roční odchylka)"
  ),

  de_DE = list(
    locale_lc_time = "de_DE.UTF-8",
    title = bquote("Monatliche durchschnittliche"~CO[2]*"-Konzentration"),
    subtitle = "Mauna Loa",
    caption_scripps = paste("Datei : R. F. Keeling, S. J. Walker, S. C. Piper und A. F. Bollenbacher\nScripps CO2 Program (https://scrippsco2.ucsd.edu/). Zugänglich am", Sys.Date()),
    caption_noaa = paste("Datei : Dr. Pieter Tans, NOAA/ESRL (https://gml.noaa.gov/ccgg/trends/) und\nDr. Ralph Keeling, Scripps Institution of Oceanography (https://scrippsco2.ucsd.edu/). Zugänglich am", Sys.Date()),
    x = "Jahr",
    y = bquote(CO[2]*"-Anteil in trockener Luft ("*mu*"mol/mol)"),
    x2 = "Monate",
    y2 = bquote(atop(CO[2]*"-Anteil in trockener Luft ("*mu*"mol/mol)", "Abweichung vom Jahresmittel")),
    title2 = "Monatliche Variation"
  ),

  en_US = list(
    locale_lc_time = "en_US.UTF-8",
    title = bquote("Monthly mean"~CO[2]~"concentration"),
    subtitle = "Mauna Loa",
    caption_scripps = paste("Data : R. F. Keeling, S. J. Walker, S. C. Piper and A. F. Bollenbacher\nScripps CO2 Program (https://scrippsco2.ucsd.edu/). Accessed", Sys.Date()),
    caption_noaa = paste("Data : Dr. Pieter Tans, NOAA/ESRL (https://gml.noaa.gov/ccgg/trends/) and\n Dr. Ralph Keeling, Scripps Institution of Oceanography (https://scrippsco2.ucsd.edu/). Accessed ", Sys.Date()),
    x = "Year",
    y = bquote(CO[2]~"fraction in dry air ("*mu*"mol/mol)"),
    x2 = "Month",
    y2 = bquote(atop(CO[2]~"fraction in dry air ("*mu*"mol/mol)", "Departure from yearly average")),
    title2 = "Seasonal variation"
  ),

  es_ES = list(
    locale_lc_time = "es_ES.UTF-8",
    title = bquote("Media mensual de la concentración de"~CO[2]),
    subtitle = "Mauna Loa",
    caption_scripps = paste("dato : R. F. Keeling, S. J. Walker, S. C. Piper y A. F. Bollenbacher\nScripps CO2 Program (https://scrippsco2.ucsd.edu/). Visitada", Sys.Date()),
    caption_noaa = paste("dato : Dr. Pieter Tans, NOAA/ESRL (https://gml.noaa.gov/ccgg/trends/) y\nDr. Ralph Keeling, Scripps Institution of Oceanography (https://scrippsco2.ucsd.edu/). Visitada", Sys.Date()),
    x = "Año",
    y = bquote("Fraccion de"~CO[2]~"en aire secco ("*mu*"mol/mol)"),
    x2 = "Mes",
    y2 = bquote(atop("Fraccion de"~CO[2]~"en aire secco ("*mu*"mol/mol)", "Desviación de la media anual")),
    title2 = "Variación mensual"
  ),

  fr_FR = list(
    locale_lc_time = "fr_FR.UTF-8",
    title = bquote("Moyenne mensuelle de la concentration de"~CO[2]),
    subtitle = "Mauna Loa",
    caption_scripps = paste("données : R. F. Keeling, S. J. Walker, S. C. Piper et A. F. Bollenbacher\nScripps CO2 Program (https://scrippsco2.ucsd.edu/). Accédé le", Sys.Date()),
    caption_noaa = paste("données : Dr Pieter Tans, NOAA/ESRL (https://gml.noaa.gov/ccgg/trends/) et\n Dr. Ralph Keeling, Scripps Institution of Oceanography (https://scrippsco2.ucsd.edu/). Accédé le", Sys.Date()),
    x = "année",
    y = bquote("fraction de"~CO[2]~"dans l'air sec ("*mu*"mol/mol)"),
    x2 = "mois",
    y2 = bquote(atop("fraction de"~CO[2]~"dans l'air sec ("*mu*"mol/mol)", "en écart à la moyenne annuelle")),
    title2 = "Variation saisonnière"
  ),

    nl_NL = list(
    locale_lc_time = "nl_NL.UTF-8",
    title = bquote("Maandelijkse gemiddelde"~CO[2]*"-concentratie"),
    subtitle = "Mauna Loa",
    caption_scripps = glue("Gegevens : R. F. Keeling, S. J. Walker, S. C. Piper en A. F. Bollenbacher\nScripps CO2 Program (https://scrippsco2.ucsd.edu/). Geopend {Sys.Date()}"),
    caption_noaa = glue("Gegevens : Dr. Pieter Tans, NOAA/ESRL (https://gml.noaa.gov/ccgg/trends/) en\n Dr. Ralph Keeling, Scripps Institution of Oceanography (https://scrippsco2.ucsd.edu/). Accessed  {Sys.Date()}"),
    x = "Jaar",
    y = bquote(CO[2]*"-fractie in droge lucht ("*mu*"mol/mol)"),
    x2 = "Mannd",
    y2 = bquote(atop(CO[2]*"-fractie in droge lucht ("*mu*"mol/mol)", "Afwijking van jaargemiddelde")),
    title2 = "Seizoensgebonden variatie"
  ),

  nn_NO = list(
    locale_lc_time = "nn_NO.UTF-8",
    title = bquote("Gjennomsnittlig månedlig"~CO[2]*"-konsentrasjon"),
    subtitle = "Mauna Loa",
    caption_scripps = paste("data : R. F. Keeling, S. J. Walker, S. C. Piper og A. F. Bollenbacher\nScripps CO2 Program (https://scrippsco2.ucsd.edu/). Vist", Sys.Date()),
    caption_noaa = paste("data : Dr. Pieter Tans, NOAA/ESRL (https://gml.noaa.gov/ccgg/trends/) og\nDr. Ralph Keeling, Scripps Institution of Oceanography (https://scrippsco2.ucsd.edu/). Vist", Sys.Date()),
    x = "År",
    y = bquote(CO[2]*"-andel i tørr luft ("*mu*"mol/mol)"),
    x2 = "Måned",
    y2 = bquote(atop(CO[2]*"-andel i tørr luft ("*mu*"mol/mol)",
                     "Avvik fra årlig gjennomsnitt")),
    title2 = "Årlig variasjon"
  ),

  pl_PL = list(
    locale_lc_time = "pl_PL.UTF-8",
    title = bquote("Średnie miesięczne stężenie"~CO[2]),
    subtitle = "Mauna Loa",
    caption_scripps = paste("Dane : R. F. Keeling, S. J. Walker, S. C. Piper i A. F. Bollenbacher\nScripps CO2 Program (https://scrippsco2.ucsd.edu/). Dostęp na", Sys.Date()),
    caption_noaa = paste("Dane : Dr. Pieter Tans, NOAA/ESRL (https://gml.noaa.gov/ccgg/trends/) i\nDr. Ralph Keeling, Scripps Institution of Oceanography (https://scrippsco2.ucsd.edu/). Dostęp na", Sys.Date()),
    x = "Rok",
    y = bquote("Frakcja"~CO[2]~"w suchym powietrzu ("*mu*"mol/mol)"),
    x2 = "Miesiąc",
    y2 = bquote(atop("Frakcja"~CO[2]~"w suchym powietrzu ("*mu*"mol/mol)", "Odejście od średniej rocznej")),
    title2 = "Wahania sezonowe"
  ),

  ro_RO = list(
    locale_lc_time = "ro_RO.UTF-8",
    title = bquote("Concentrația medie lunară de"~CO[2]),
    subtitle = "Mauna Loa, Hawaii",
    caption_scripps = paste("Date: R. F. Keeling, S. J. Walker, S. C. Piper și A. F. Bollenbacher\nScripps CO2 Program (https://scrippsco2.ucsd.edu/). Accesat în", Sys.Date()),
    caption_noaa = paste("Date : Dr. Pieter Tans, NOAA/ESRL (https://gml.noaa.gov/ccgg/trends/) și\n Dr. Ralph Keeling, Scripps Institution of Oceanography (https://scrippsco2.ucsd.edu/). Accesat în", Sys.Date()),
    x = "An",
    y = bquote("Ponderea"~CO[2]~"în aer uscat ("*mu*"mol/mol)"),
    x2 = "Lună",
    y2 = bquote(atop("Abaterea cotei"~CO[2]~"în aer uscat ("*mu*"mol/mol)", "Abatere de la media anuală")),
    title2 = "Variație sezonieră"
  ),

  ru_RU = list(
    locale_lc_time = "ru_RU.UTF-8",
    title = bquote("Среднемесячная и среднегодовая концентрации"~CO[2]),
    subtitle = "Мауна Лоа, Гаваи",
    caption_scripps = paste("данные : R. F. Keeling, S. J. Walker, S. C. Piper и A. F. Bollenbacher\nScripps CO2 Program (https://scrippsco2.ucsd.edu/). доступ на", Sys.Date()),
    caption_noaa = paste("данные : Dr. Pieter Tans, NOAA/ESRL (https://gml.noaa.gov/ccgg/trends/) и\nDr. Ralph Keeling, Scripps Institution of Oceanography (https://scrippsco2.ucsd.edu/). доступ на ", Sys.Date()),
    x = "Годы",
    y = bquote("Доля"~CO[2]~"в сухом воздухе ("*mu*"mol/mol)"),
    x2 = "Месяцы",
    y2 = bquote(atop("Отклонение доли"~CO[2]~"в сухом воздухе", "от среднегодового значения, мкмоль/моль")),
    title2 = "Сезонные колебания"
  )

)


# Data --------------------------------------------------------------------

# First try NOAA data, if not availble use Scripps data
if (!http_error("ftp://aftp.cmdl.noaa.gov/products/trends/co2/co2_mm_mlo.txt")) {
  # https://gml.noaa.gov/ccgg/trends/data.html
  source <- "noaa"
  co2ml <- read_table(
    "ftp://aftp.cmdl.noaa.gov/products/trends/co2/co2_mm_mlo.txt",
    col_names = c("year", "month", "decimal", "average", "deseason", "ndays", "stddays", "unc"),
    col_types = "iidddidd",
    na = c("-99.99", "-1"),
    comment = "#") %>%
    group_by(year) %>%
    mutate(year_mean = mean(average, na.rm = TRUE),
           delta = average - year_mean,
           vdate = ymd(paste0("2015-", month, "-01")))%>%
    rename(co2 = average)

} else {
  # https://scrippsco2.ucsd.edu/data/atmospheric_co2/primary_mlo_co2_record
  # used during US gov shutdown
  source <- "scripps"
  co2ml <- read_csv(
    "https://scrippsco2.ucsd.edu/assets/data/atmospheric/stations/in_situ_co2/monthly/monthly_in_situ_co2_mlo.csv",
    col_names = c("year", "month", "xls_date", "decimal",
                  "co2_raw", "co2_raw_seas_adj", "fit", "fit_seas_adj",
                  "co2_filled", "co2_filled_seas_adj"),
    col_types = "iiiddddddd",
    skip = 57,
    na = "-99.99",
    comment = "\"") %>%
    group_by(year) %>%
    mutate(year_mean = mean(co2_filled, na.rm = TRUE),
           delta = co2_filled - year_mean,
           vdate = ymd(paste0("2015-", month, "-01"))) %>%
    rename(co2 = co2_filled)
}


# Generate the plot for each language -------------------------------------

for (l in names(language)) {
  message(l)
  current <- language[[l]]

  # format the date in local names
  Sys.setlocale("LC_TIME", current$locale_lc_time)

  # main plot
  p1 <- ggplot(co2ml, aes(decimal, co2)) +
    geom_line(color = "pink") +
    geom_point(color = "red", size = 0.6) +
    stat_smooth(span = 0.1) +
    scale_x_continuous(breaks = pretty_breaks()) +
    scale_y_continuous(breaks = pretty_breaks()) +
    labs(x = current$x,
         y = current$y,
         title = current$title,
         subtitle = paste(current$subtitle, min(co2ml$year), "-", max(co2ml$year)),
         caption = paste(current[[paste0("caption_", source)]],
                         "https://w.wiki/4ZWn", sep = "\n")) +
    theme_bw() +
    theme(plot.caption = element_text(size = 7))

  # inset plot
  p2 <- ggplot(co2ml, aes(vdate, delta)) +
    geom_hline(yintercept = 0) +
    stat_smooth(span = 0.4, se = FALSE) +
    stat_summary(fun.data = "mean_cl_boot", colour = "red", size = 0.3) +
    scale_x_date(breaks = pretty_breaks(4),
                 minor_breaks = pretty_breaks(12),
                 labels = date_format("%b")) +
    labs(x = current$x2,
         y = current$y2,
         title = current$title2) +
    theme_bw()

  # merge the plots and export in SVG
  p1 + annotation_custom(grob = ggplotGrob(p2),
                         xmin = 1957, xmax = 1991, ymin = 361, ymax = 420)

  ggsave(file = paste("co2_mauna_loa", l, Sys.Date(), "wp.svg", sep = "_"),
         width = 20,
         height = 20,
         units = "cm",
         device = svg)
}

# return to former locale
Sys.setlocale("LC_TIME", old_locale)


