Butun axtardiqlarinizi tapmaq ucun buraya: DAXIL OLUN
  Mp4 Mp3 Axtar Yukle
  Video Axtar Yukle
  Shekil Axtar Yukle
  Informasiya Melumat Axtar
  Hazir Inshalar Toplusu
  AZERI CHAT + Tanishliq
  1-11 Sinif Derslikler Yukle
  Saglamliq Tibbi Melumat
  Whatsapp Plus Yukle(Yeni)

  • Ana səhifə
  • Təsadüfi
  • Yaxınlıqdakılar
  • Daxil ol
  • Nizamlamalar
İndi ianə et Əgər Vikipediya sizin üçün faydalıdırsa, bu gün ianə edin.

Fayl:Hamiltonian flow classical.gif

  • Fayl
  • Müzakirə
  • Lokal izah əlavə et
  • Fayl
  • Faylın tarixçəsi
  • Faylın istifadəsi
  • Faylın qlobal istifadəsi
Fayl:Hamiltonian flow classical.gif
Daha yüksək versiyası yoxdur.

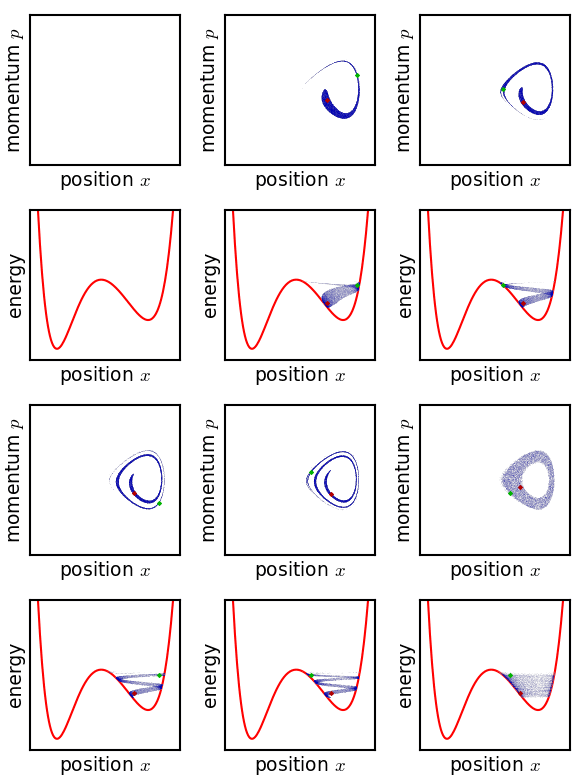
Hamiltonian_flow_classical.gif (195 × 390 piksel, fayl həcmi: 172 KB, MIME növü: image/gif, ilmələnib, 86 çərçivə, 26 s)

Bu fayl Vikianbarda yerləşir. Açıqlama səhifəsindəki məlumatlar aşağıda göstərilib.
Vikianbar azad lisenziyalı media anbarıdır. Siz də töhfə verə bilərsiniz.

Xülasə

İzahHamiltonian flow classical.gif
English: Flow of a statistical ensemble in the potential x**6 + 4*x**3 - 5*x**2 - 4*x. Over long times it becomes swirled up, and appears to become a smooth and stable distribution. However, this stability is an artifact of the pixelization (the actual structure is too fine to perceive).
This animation is inspired by a discussion of Gibbs in his 1902 wikisource:Elementary Principles in Statistical Mechanics, Chapter XII, p. 143: "Tendency in an ensemble of isolated systems toward a state of statistical equilibrium". A quantum version of this can be found at File:Hamiltonian flow quantum.webm
Tarix 27 oktyabr 2013, 00:06:21
Mənbə Öz işi
Müəllif Nanite

Source

 
This plot was created with Matplotlib.
 
This image was created with ImageMagick.

Python source code. Requires matplotlib ImageMagick. Possibly does not run in Windows.

from pylab import *
import subprocess
import sys
import os

figformat = '.png'
seterr(divide='ignore')
rcParams['font.size'] = 9

#define color map that is transparent for low values, and dark blue for high values.
# weighted to show low probabilities well
cdic = {'red':   [(0,0,0),(1,0,0)],
        'green': [(0,0,0),(1,0,0)],
        'blue':  [(0,0.7,0.7),(1,0.7,0.7)],
        'alpha': [(0,0,0),
                  (0.1,0.4,0.4),
                  (0.2,0.6,0.6),
                  (0.4,0.8,0.8),
                  (0.6,0.9,0.9),
                  (1,1,1)]}
cm_prob = matplotlib.colors.LinearSegmentedColormap('prob',cdic,N=640)

### System dynamics ###

# potential is a polynomial
potential_coefs = array([1,0,0,4,-5,-4,0],'d')
def potential(x,t):
    return polyval(potential_coefs,x)

# force function is its derivative.
force_coefs = (potential_coefs*arange(len(potential_coefs)-1,-1,-1))[:-1]
def force(x,t):
    """ derivative of potential(x) """
    return polyval(force_coefs,x)
invmass = 1.0
dt = 0.03

def motion(t,x,p):
    """ returns dx/dt, dp/dt """
    return p*invmass, -force(x,t)

cur_x = -0.1
cur_p = 0

def rkky_step(t, x_i, p_i, dt):
    kx1,kp1 = motion(t, x_i, p_i)
    dt2 = 0.5*dt
    kx2,kp2 = motion(t+dt2, x_i+dt2*kx1, p_i+dt2*kp1)
    kx3,kp3 = motion(t+dt2, x_i+dt2*kx2, p_i+dt2*kp2)
    kx4,kp4 = motion(t+dt, x_i+dt*kx3, p_i+dt*kp3)
    newx = x_i + (dt/6.0)*(kx1 + 2.0*kx2 + 2.0*kx3 + kx4)
    newp = p_i + (dt/6.0)*(kp1 + 2.0*kp2 + 2.0*kp3 + kp4)
    return newx, newp

### Setup ensemble points ###

# most are randomly chosen
x = 0 + 0.5*rand(20000)
p = -1.0 + 2.0*rand(20000)

# the pilot points are set manually
x[0] = 0;    p[0] = 0
x[1] = 0.4;  p[1] = 0.0
pilots = [0,1]
pilot_colors = {
       0: (0,0.7,0),
       1: (0.7,0,0)}
E = potential(x,0) + 0.5*invmass*p**2

### set up plot limits and histogram bins ###
xedges = linspace(-2.1,1.7,151)
pedges = linspace(-7.5,7.5,151)
Eedges = linspace(-9,9,151)
pix = 150
extent = [xedges[0], xedges[-1], pedges[-1], pedges[0]]
H = histogram2d(x,p,bins=[xedges,pedges])[0].transpose()
cmax = amax(H)*0.8

extenten = [xedges[0], xedges[-1], Eedges[-1], Eedges[0]]
Hen = histogram2d(x,E,bins=[xedges,Eedges])[0].transpose()
cmaxen = amax(Hen)*0.3

fig = figure(1)
ysize = 2.6
xsize = 1.3
fig.set_size_inches(xsize,ysize)

### Prepare lower plot ###
axen = axes((0.2/xsize,0.2/ysize,1.0/xsize,1.0/ysize),frameon=True)
axen.xaxis.set_ticks([])
axen.xaxis.labelpad = 2
axen.yaxis.set_ticks([])
axen.yaxis.labelpad = 2
xlim(-2.1,1.7)
ylim(-9,9)
xlabel('position $x$')
ylabel('energy')
potx = linspace(-2.1,1.7,151)

### Prepare upper plot ###
ax = axes((0.2/xsize,1.5/ysize,1.0/xsize,1.0/ysize),frameon=True)
ax.xaxis.set_ticks([])
ax.xaxis.labelpad = 2
ax.yaxis.set_ticks([])
ax.yaxis.labelpad = 2
xlim(-2.1,1.7)
ylim(-7.5,7.5)
xlabel('position $x$')
ylabel('momentum $p$')

### Start running simulation ###
frames = list()
delays = list()
framemod = 5
frame = "frames/background"+figformat
savefig(frame,dpi=pix)
frames.append(frame)
delays.append(16)

print "generating frames...  0%",
sys.stdout.flush()
savesteps = range(0,401,framemod) + [600, 1000, 2000, 6000]
delays += [10]*len(savesteps)
delays[1] = 200
delays[-5:] = [100,200,200,200,400]
totalsteps = max(savesteps)+1
for step in range(totalsteps):
    if step % 20 == 0:
        print "\b\b\b\b\b{0:3}%".format(int(round(step*100.0/totalsteps))),
        sys.stdout.flush()
    if step in savesteps:
        # Every several frames, do a plot
        remlist = list()

        sca(ax)
        H = histogram2d(x,p,bins=[xedges,pedges])[0].transpose()
        remlist.append(imshow(H, extent=extent, cmap=cm_prob, interpolation='none', aspect='auto'))
        remlist[-1].set_clim(0,cmax)
        for i in pilots:
            remlist += plot(x[i], p[i], '.', color=pilot_colors[i], markersize=3)

        E = potential(x,step*dt) + 0.5*invmass*p**2
        sca(axen)
        pot = potential(potx,step*dt)
        remlist += plot(potx,pot,color='r',zorder=0)
        Hen = histogram2d(x,E,bins=[xedges,Eedges])[0].transpose()
        remlist.append(imshow(Hen, extent=extenten, cmap=cm_prob, interpolation='none', aspect='auto',zorder=1))
        remlist[-1].set_clim(0,cmaxen)
        for i in pilots:
            remlist += plot(x[i], E[i], '.', color=pilot_colors[i], markersize=3)

        frame = "frames/frame"+str(step)+figformat
        savefig(frame,dpi=pix)
        frames.append(frame)
        # Clear out updated stuff.
        for r in remlist: r.remove()
    x, p = rkky_step(step*dt, x, p,dt)
print "\b\b\b\b\b      done"

assert(len(delays) == len(frames))

### Assemble animation using ImageMagick ###
calllist = 'convert -dispose Background'.split()
for delay,frame in zip(delays,frames):
    calllist += ['-delay',str(delay)]
    calllist += [frame]
calllist += '-loop 0 -layers Optimize _animation.gif'.split()
f = open('anim_command.txt','w')
f.write(' '.join(calllist)+'\n')
f.close()

print "composing into animated gif...",
sys.stdout.flush()
subprocess.call(calllist)
print "      done"
os.rename('_animation.gif','animation.gif')

Lisenziya

Mən, bu işin müəllif hüquqları sahibi, onu aşağıdakı lisenziyaya əsasən dərc edirəm:
Creative Commons CC-Zero Bu fayl Creative Commons CC0 1.0 Universal Public Domain Dedication lisenziyası altında yayımlanır.
Əsəri bu sənədlə əlaqələndirən şəxs müəllif hüquqları qanununa əsasən bütün dünyada qanunla icazə verilən həddə bütün əlaqəli və bitişik hüquqlar da daxil olmaqla əsərə olan bütün hüquqlarından imtina edərək əsəri ictimai mülkiyyətə buraxmışdır. Siz hətta kommersiya məqsədləri üçün icazə almadan işi kopyalaya, dəyişdirə, paylaşa bilərsiniz.

http://creativecommons.org/publicdomain/zero/1.0/deed.enCC0Creative Commons Zero, Public Domain Dedicationfalsefalse

Başlıqlar

Bu faylın nəyi təmsil etdiyinə dair bir sətirlik izahat əlavə et

Bu faylda təsvir olunan elementlər

təsvir edir

yaradıcı

Vikidata elementi olmayan bir neçə dəyər

Vikimedia istifadəçi adı: Nanite
müəllifin qısa adı: Nanite
URL: /wiki/user:Nanite

copyright status ingilis

müəllif hüquqları ilə qorunur, lakin müəllif hüquqlarının sahibi tərəfindən ictimai istifadəyə verilmişdir

lisenziya

Creative Commons CC0 License ingilis

yaranma tarixi

27 oktyabr 2013

source of file ingilis

original creation by uploader ingilis

media type ingilis

image/gif

Faylın tarixçəsi

Faylın əvvəlki versiyasını görmək üçün gün/tarix bölməsindəki tarixlərə klikləyin.

Tarix/VaxtMiniatürÖlçülərİstifadəçiŞərh
hal-hazırkı08:57, 27 oktyabr 201308:57, 27 oktyabr 2013 tarixindəki versiyanın miniatür görüntüsü195 × 390 (172 KB)NaniteAdded potential plot (with bonus ensemble histogram in E,x), as well as a couple of "pilot" systems.
22:39, 26 oktyabr 201322:39, 26 oktyabr 2013 tarixindəki versiyanın miniatür görüntüsü195 × 195 (84 KB)Nanitehigher resolution + a big longer in time to get the smooth look.
22:10, 26 oktyabr 201322:10, 26 oktyabr 2013 tarixindəki versiyanın miniatür görüntüsü195 × 195 (84 KB)NaniteUser created page with UploadWizard

Faylın istifadəsi

Aşağıdakı səhifə bu faylı istifadə edir:

  • Ulduz dinamikası

Faylın qlobal istifadəsi

Bu fayl aşağıdakı vikilərdə istifadə olunur:

  • ar.wikipedia.org layihəsində istifadəsi
    • مبرهنة ليوفيل (ميكانيك هاملتوني)
  • ast.wikipedia.org layihəsində istifadəsi
    • Teoría ergódica
  • en.wikipedia.org layihəsində istifadəsi
    • Ensemble (mathematical physics)
    • Phase space
    • Ergodic theory
    • H-theorem
    • Stellar dynamics
    • User:Nanite
    • User:Molybdenumus/statistical ensemble/representations
    • Talk:Mixing (mathematics)/Archive 1
  • en.wikiversity.org layihəsində istifadəsi
    • Advanced Classical Mechanics/Phase Space
  • es.wikipedia.org layihəsində istifadəsi
    • Teoría ergódica
  • fr.wikipedia.org layihəsində istifadəsi
    • Espace des phases
    • Théorie ergodique
  • id.wikipedia.org layihəsində istifadəsi
    • Teorema Liouville (Hamiltonian)
  • ja.wikipedia.org layihəsində istifadəsi
    • リウヴィルの定理 (物理学)
  • mk.wikipedia.org layihəsində istifadəsi
    • Ѕвездена динамика
  • pt.wikipedia.org layihəsində istifadəsi
    • Teoria ergódica
    • Usuário(a):WilsonNeuroMat/Testes56
  • sl.wikipedia.org layihəsində istifadəsi
    • Izrek H
Mənbə — "https://az.wikipedia.org/wiki/Fayl:Hamiltonian_flow_classical.gif"
Informasiya Melumat Axtar